USD/INR Price Analysis: Indian rupee rebounds towards 200-SMA near 79.60
- USD/INR snaps three-day uptrend as it retreats towards the key SMA, Fibonacci retracement levels.
- Six-week-old descending trend line holds the key to buyer’s conviction.
- Multiple troughs could test the pair bears before the previous monthly low.
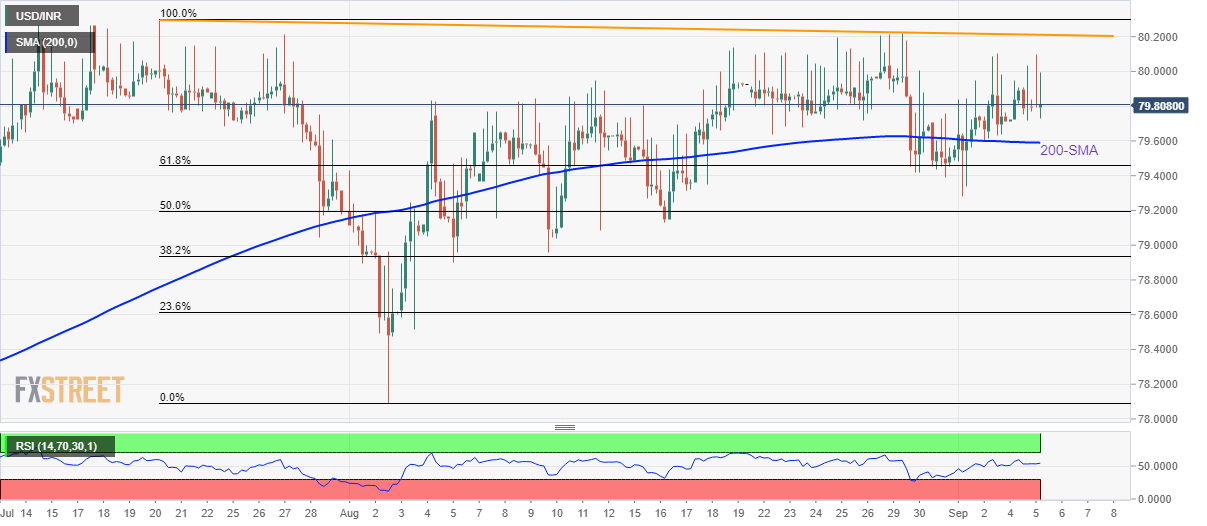
USD/INR retreats to 79.80, after a three-day uptrend, as buyers run out of steam during Tuesday’s Asian session. In doing so, the Indian rupee (INR) pair fades bounce off the 200-SMA, as well as the 61.8% Fibonacci retracement of July 21 to August 02 downside.
Given the steady RSI and the pair’s multiple failures to cross a downward sloping resistance line from late July, the USD/INR sellers are likely to be welcomed for the short-term.
During their stay, the 200-SMA and the 61.8% golden ratio, respectively near 79.60 and 79.45, will be crucial to watch for further dominance.
Also acting as the downside filter is the mid-August low and the 38.2% Fibonacci retracement level, close to 79.10 and the 79.00 round figure.
It should be noted, however, that a downside break of the 79.00 threshold, could make the pair vulnerable to drops towards the previous monthly low near 78.10.
On the flip side, a daily closing beyond the aforementioned resistance line, at 80.20 by the press time, becomes necessary for the USD/INR bulls.
Following that, the latest record high near 80.30 and 81.00 could quickly flash on the chart.
USD/INR: Four-hour chart
Trend: Further weakness expected