US Dollar Index Price Analysis: Tuesday’s Doji tests DXY bulls
- DXY struggles around 16-month top after posting bearish candlestick the previous day.
- Overbought RSI also hints at a pullback inside 13-day-old rising channel formation.
- Bears remain indecisive beyond 50-DMA, June 2020 top lures buyers.
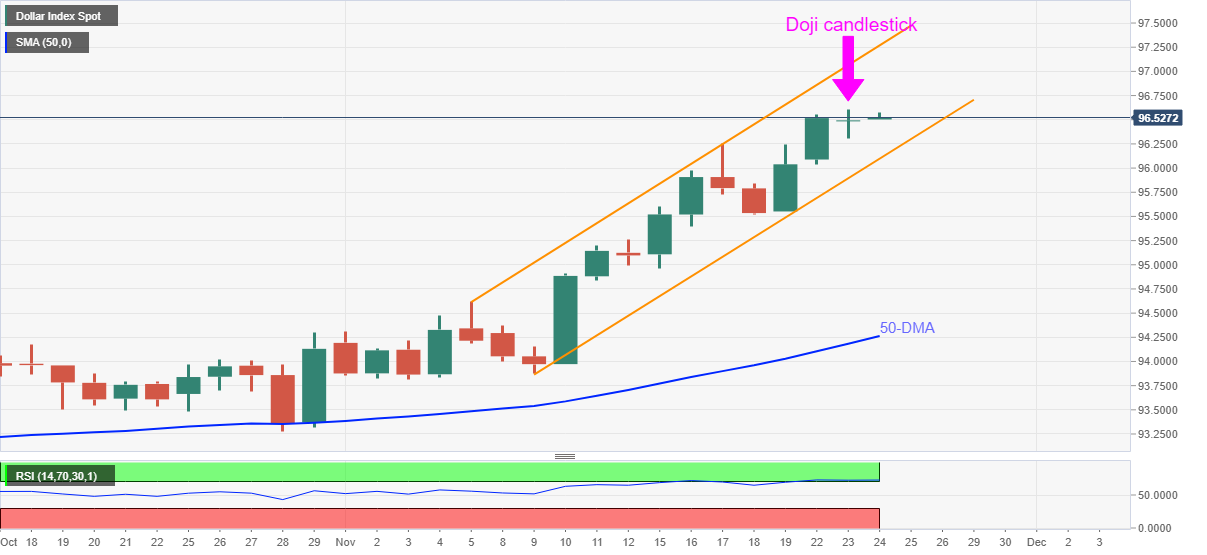
US Dollar Index (DXY) seesaws around the highest levels since July 2020, poked the previous day, during early Wednesday.
In doing so, the greenback gauge justifies Tuesday’s Doji candlestick formation while teasing the short-term sellers amid the overbought RSI line. Even so, an upward sloping trend channel from November 05 challenges the bears.
That said, the quote’s pullback moves may aim to defy the bullish chart pattern, the stated channel, while targeting the break of the 96.10 support.
Following that, the 96.00 threshold and early November’s high near 94.60 may entertain DXY sellers before the 50-DMA level of 94.25, a break of which will make the quote vulnerable to reverse the run-up from late October.
On the flip side, sustained trading beyond 96.60 will defy the bearish candlestick formation and propel the greenback gauge towards the resistance line of the channel, around 97.30 by the press time.
While the 97.00 threshold may offer an intermediate halt during the expected rise, US Dollar Index may challenge the June 2020 peak of 97.80 should it manage to rally past 97.30.
DXY: Daily chart
Trend: Pullback expected