USD/CAD Price Analysis: Pressured towards 1.3750 inside rising wedge
- USD/CAD pulls back from weekly top inside bearish chart pattern.
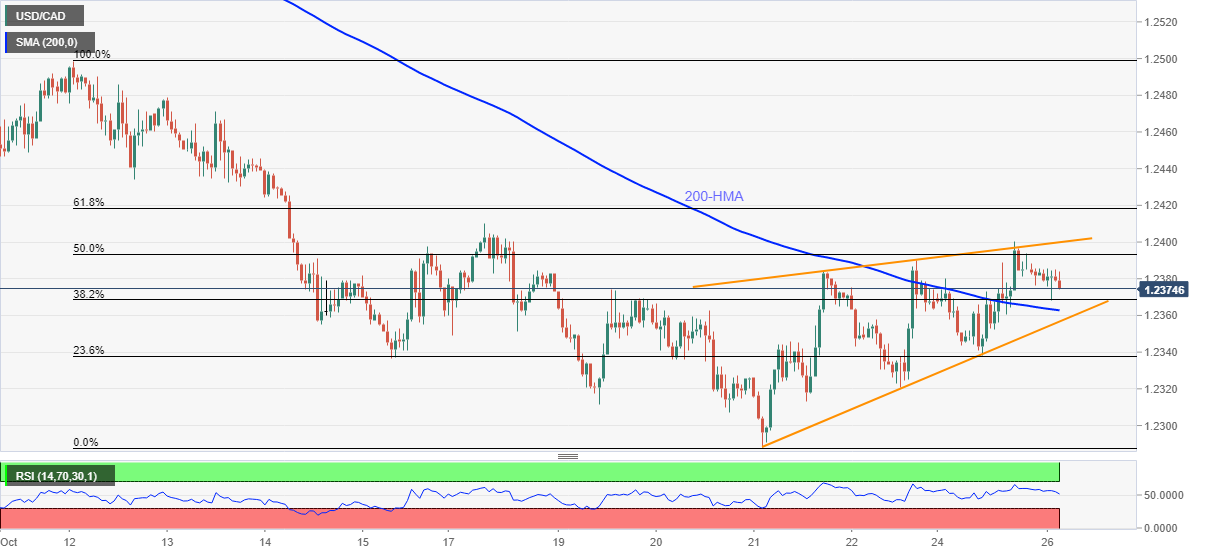
- Descending RSI line directs intraday sellers towards 200-HMA.
- Last weekly high, 61.8% Fibonacci retracement challenge short-term upside.
USD/CAD fails to extend the previous day’s rebound while taking offers around 1.2375, down 0.08% intraday ahead of Tuesday’s European session.
The Loonie pair’s pullback portrays a bearish chart pattern, namely rising wedge, on the hourly play. The same joins downward sloping RSI line to highlight the 200-HMA level of 1.2362 as immediate support.
However, the quote’s weakness past 1.2362 needs validation from the stated wedge’s support line, near 1.2355 by the press time, a break of which will direct the USD/CAD bears towards the monthly low of 1.2288 before pressuring the prices towards late June’s low of 1.2252.
Alternatively, recovery moves remain less important below the wedge’s resistance line, close to the 1.2400 threshold at the latest.
Also challenging the short-term USD/CAD recovery is the October 18 top of 1.2410 and 61.8% Fibonacci retracement of October 12-21 declines, near 1.2420.
Overall, USD/CAD remains on the back foot and hence confirmation of the rising wedge will add strength to the bearish impulse.
USD/CAD: Hourly chart
Trend: Further weakness expected