NZD/USD Price Analysis: Pulls back from the key HMAs towards 0.6600
- NZD/USD takes a U-turn from 0.6630 while trimming the intraday gains.
- Key Fibonacci retracements, short-term support lines can probe sellers.
- Bulls eye monthly top beyond 0.6630 resistance confluence.
NZD/USD extends pullback from 0.6630 to 0.6615 during the early Monday. In doing so, the pair reverses from a confluence of 100-HMA and 38.2% Fibonacci retracement of October 08-14 upside while also declining below 200-HMA.
The recent downside also took clues from the RSI conditions that slants southwards while flashing 0.23% gains on a day.
With the pair’s clear failures to cross the key resistances, coupled with RSI positions, the quote is likely to revisit the ascending trend line from October 15, at 0.6605 now.
However, a 61.8% Fibonacci retracement level of 0.6600 and a support line stretched from October 08, currently at 0.6585, can probe the bears for now.
Meanwhile, 200-HMA near 0.6620 offers the immediate resistance to the pair ahead of the 0.6630 key upside barrier.
If the NZD/USD manages to keep the reins after 0.6630, the monthly high of 0.6683 will be gain the buyers’ attention.
NZD/USD hourly chart
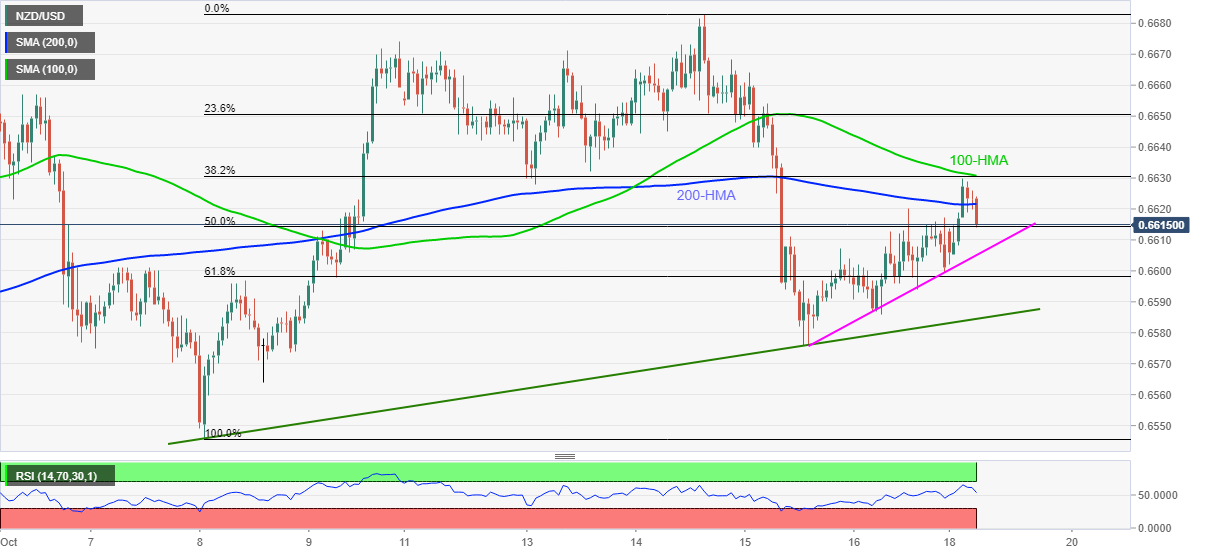
Trend: Bearish