USD/CAD Price Analysis: Seesaws inside ascending triangle below 1.3400
- USD/CAD marks another U-turn from 1.3418 to revisit the sub-1.3400 area.
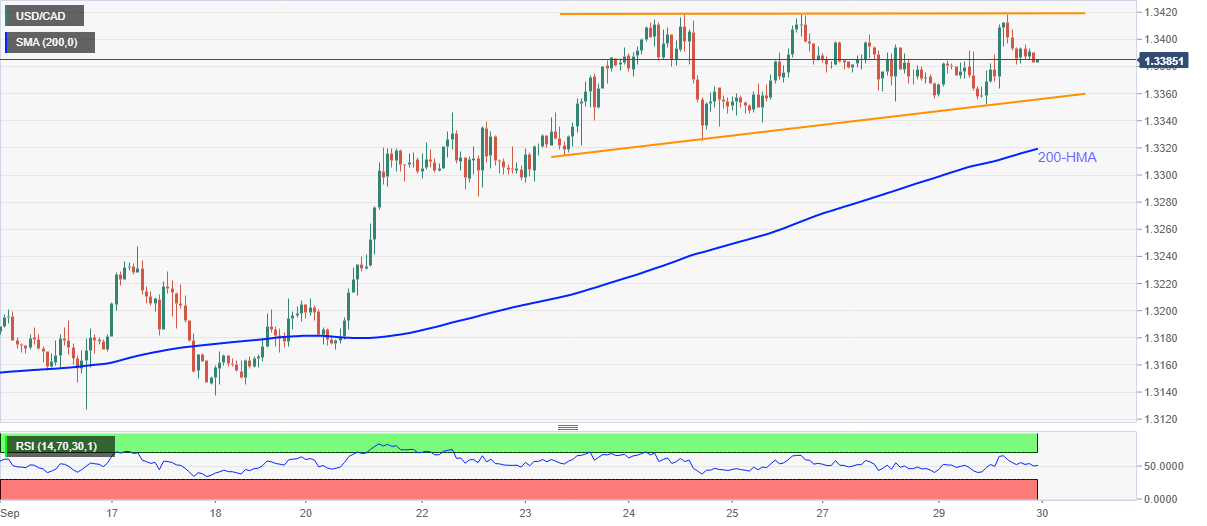
- Triangle’s support, 200-HMA offer strong challenges to sellers.
- The late-July top adds to the upside barriers.
USD/CAD eases to 1.3383 during the pre-Tokyo open trading on Wednesday. The loonie pair has so far been rejected thrice from 1.3418 upside resistance despite following a one-week-old support line. As a result, a short-term ascending triangle pattern appears on the hourly chart above 200-HMA.
Multiple pullbacks from 1.3418 join receding strength of the RSI to suggest the quote’s declines to the triangle’s support line, currently around 1.3355.
However, 200-HMA and September 22 low, respectively near 1.3320 and 1.3280, will be strongly challenging the bears below 1.3355.
On the contrary, USD/CAD rise past-1.3418 will need validation from July 30 high close to 1.3460 to convince buyers.
Following that, the June 23 low surrounding 1.3485 and the 1.3500 round-figures can return to the charts.
USD/CAD hourly chart
Trend: Pullback expected