Back
17 Mar 2020
US Dollar Index Asian Price Analysis: DXY clings to gains near 2020 highs
- DXY is in high demand amid risk-off mode.
- Key resistance is seen at the 98.75/100 price levels.
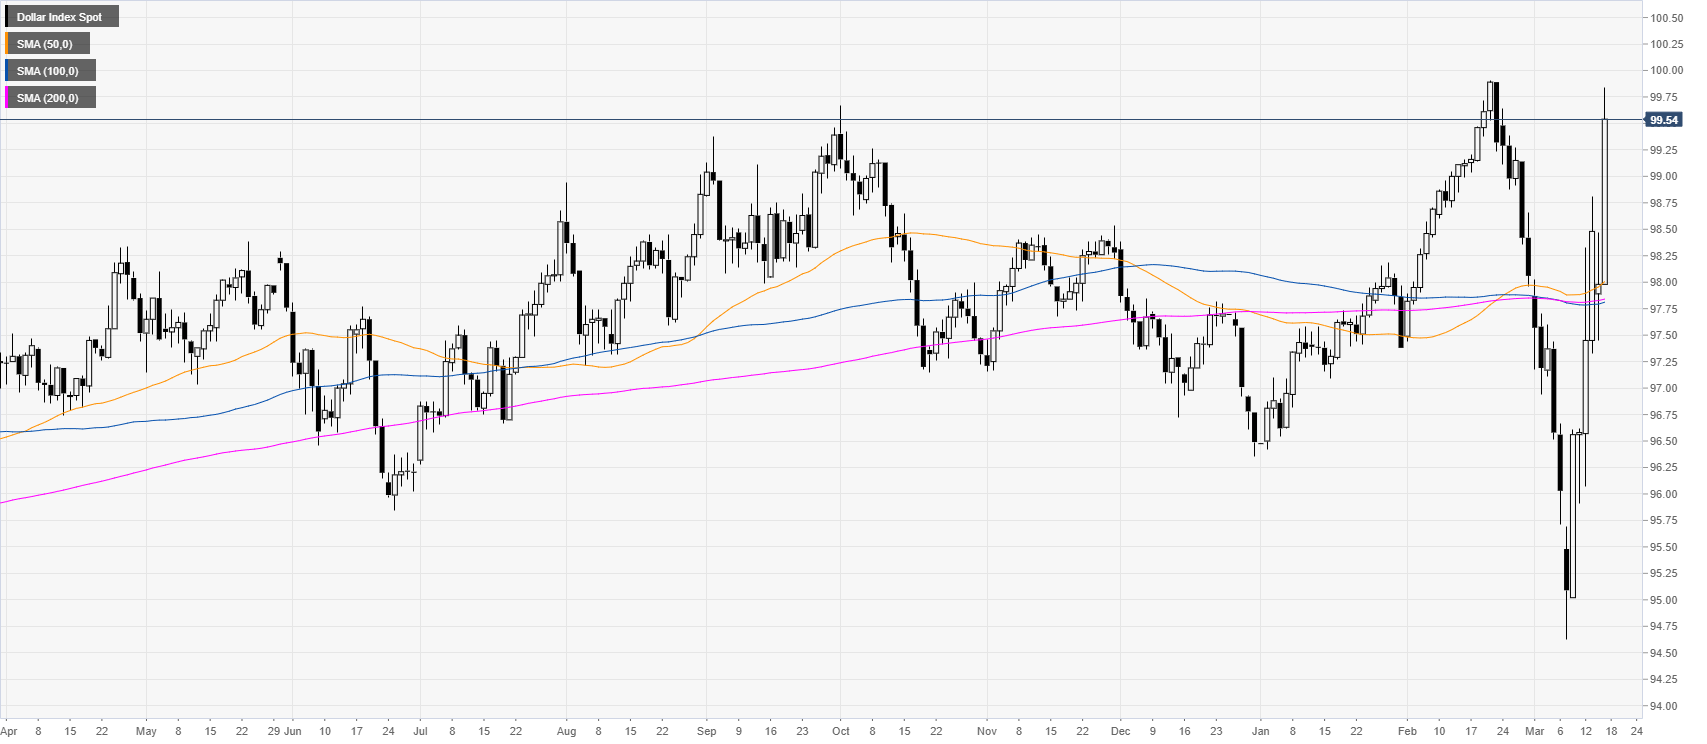
DXY daily chart
Two weeks ago, DXY (US dollar index) suffered a dramatic selloff which was then followed by the best weekly advance since October 2008. Volatility remains above average amidst the greatest drop in US equities since 2008.
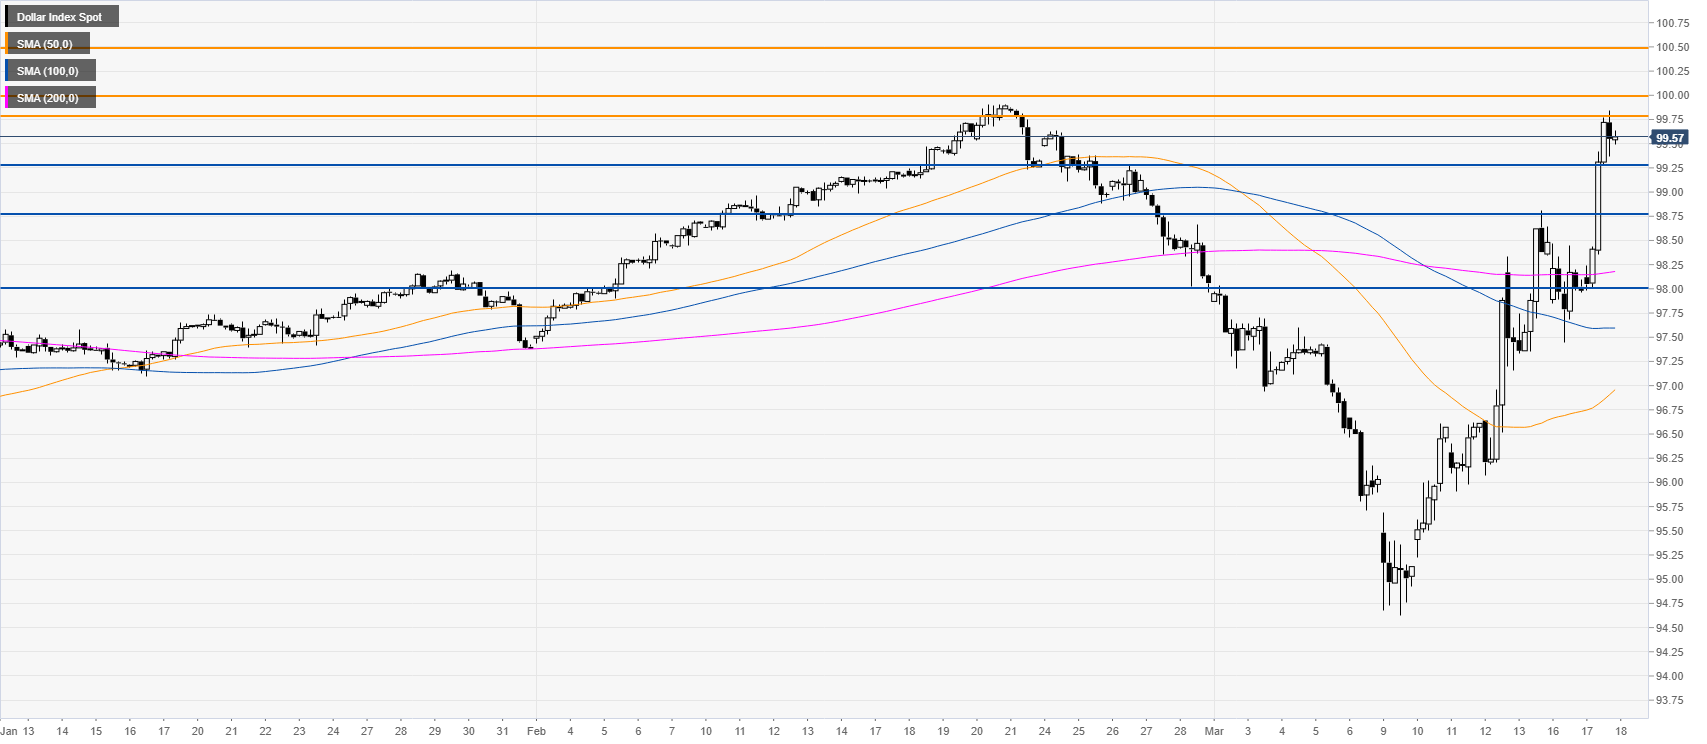
DXY four-hour chart
DXY is clinging to gains near the 2020 highs while trading above the main SMAs. As buyers are in control DXY is likely looking to break the 99.75/100.00 price zone. Resistance above includes the 100.50 and 101.00 levels. Support is seen near the 99.25, 98.75 and 98.00 levels.
Additional key levels