Back
19 Jul 2019
GBP/USD technical analysis: Cable trading at daily lows correcting Fed’s Williams inspired gains
- GBP/USD is correcting parts of Fed's Willams inspired gains made on Thursday.
- The level to beat for bears are at 1.2509 and 1.2444, according to the Technical Confluences Indicator.
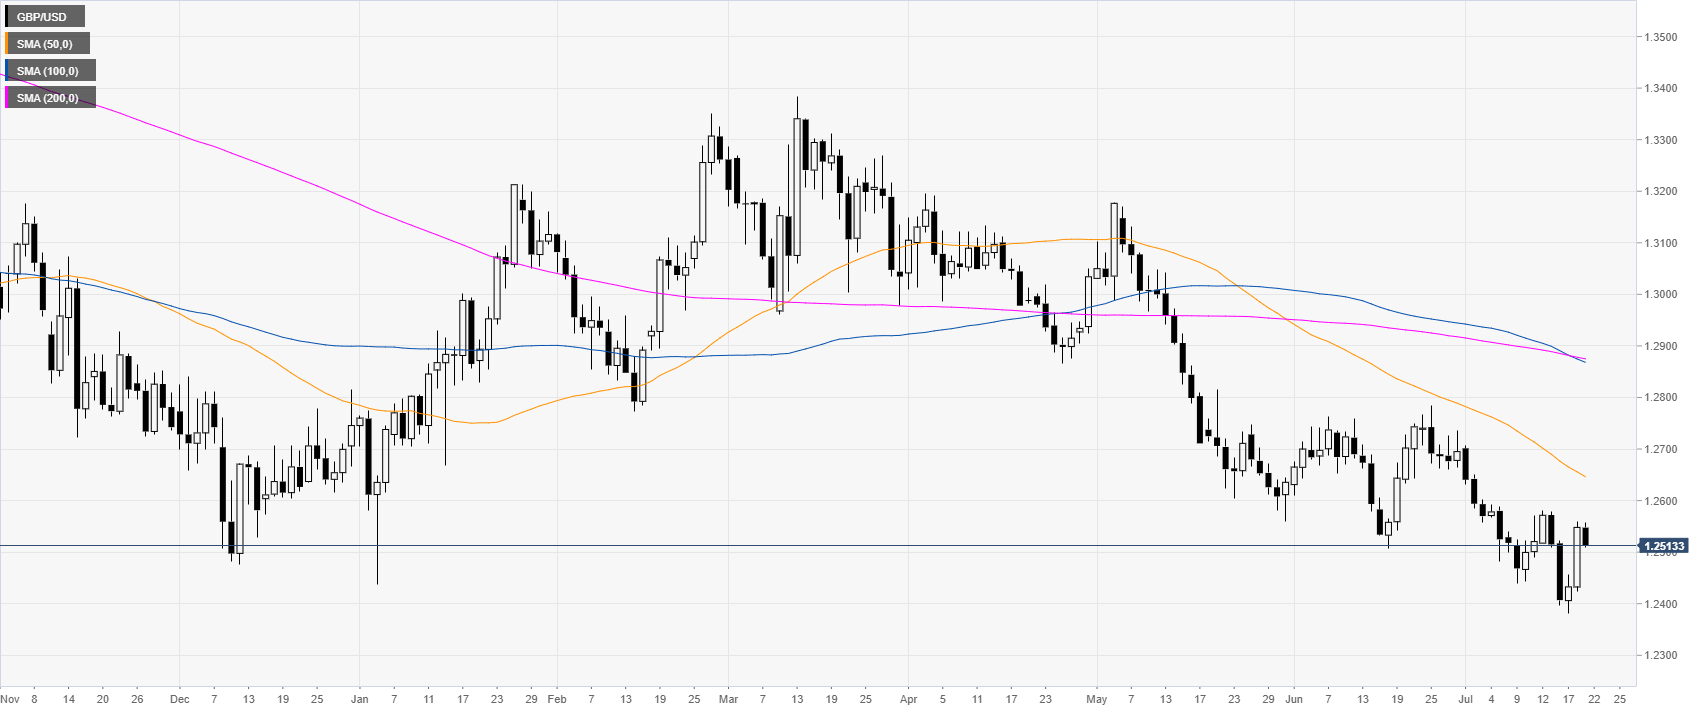
GBP/USD daily chart
GBP/USD is currently correcting Fed’s Williams spike. The market is in a bear trend below its main daily simple moving averages (DSMAs).
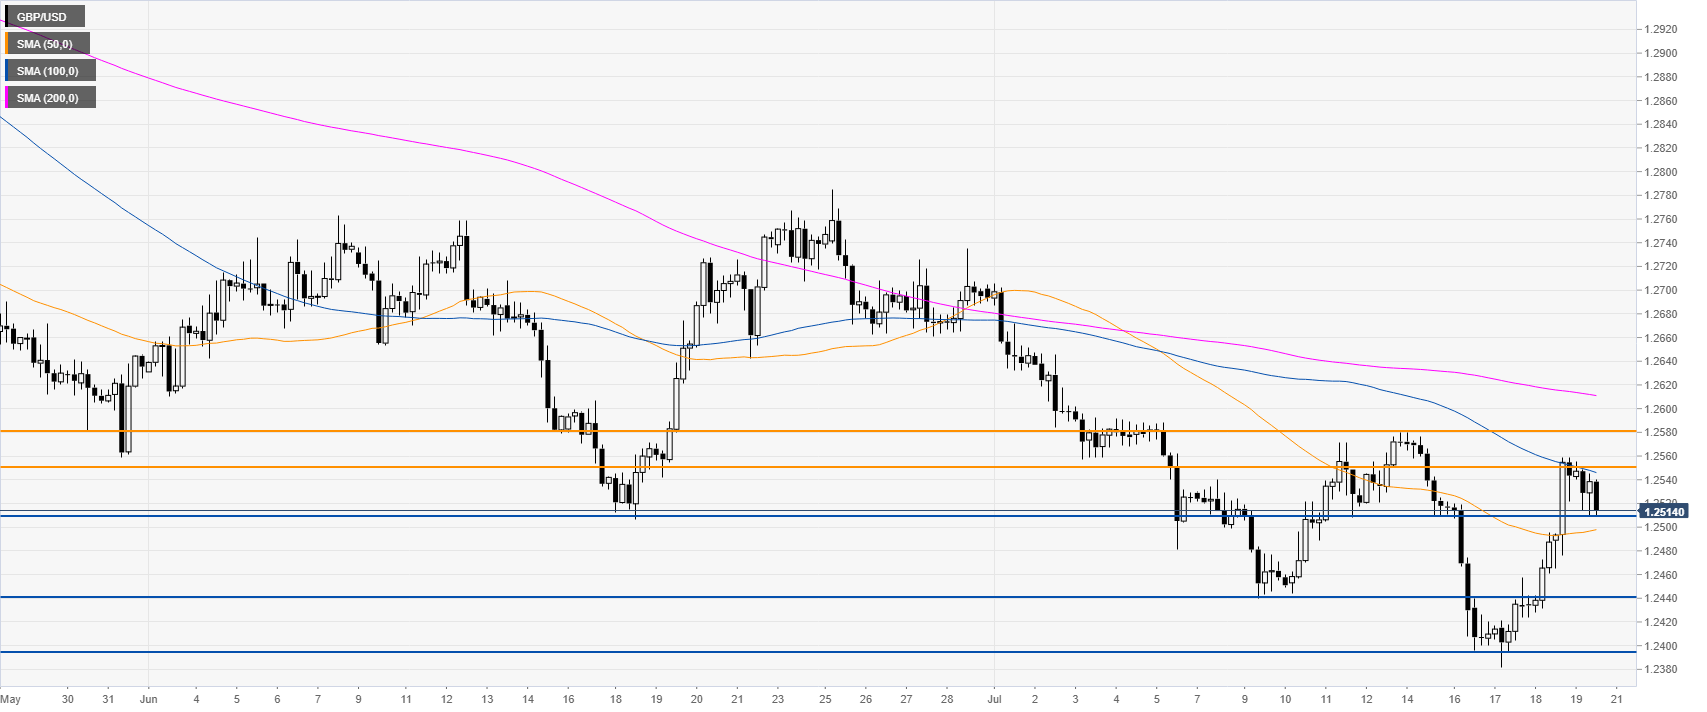
GBP/USD 4-hour chart
Cable is trading below 1.2550 resistance and the 100 and 200 SMAs. If bears break below 1.2509 support they could drive the market down towards 1.2444 and 1.2392, according to the Technical Confluences Indicator.
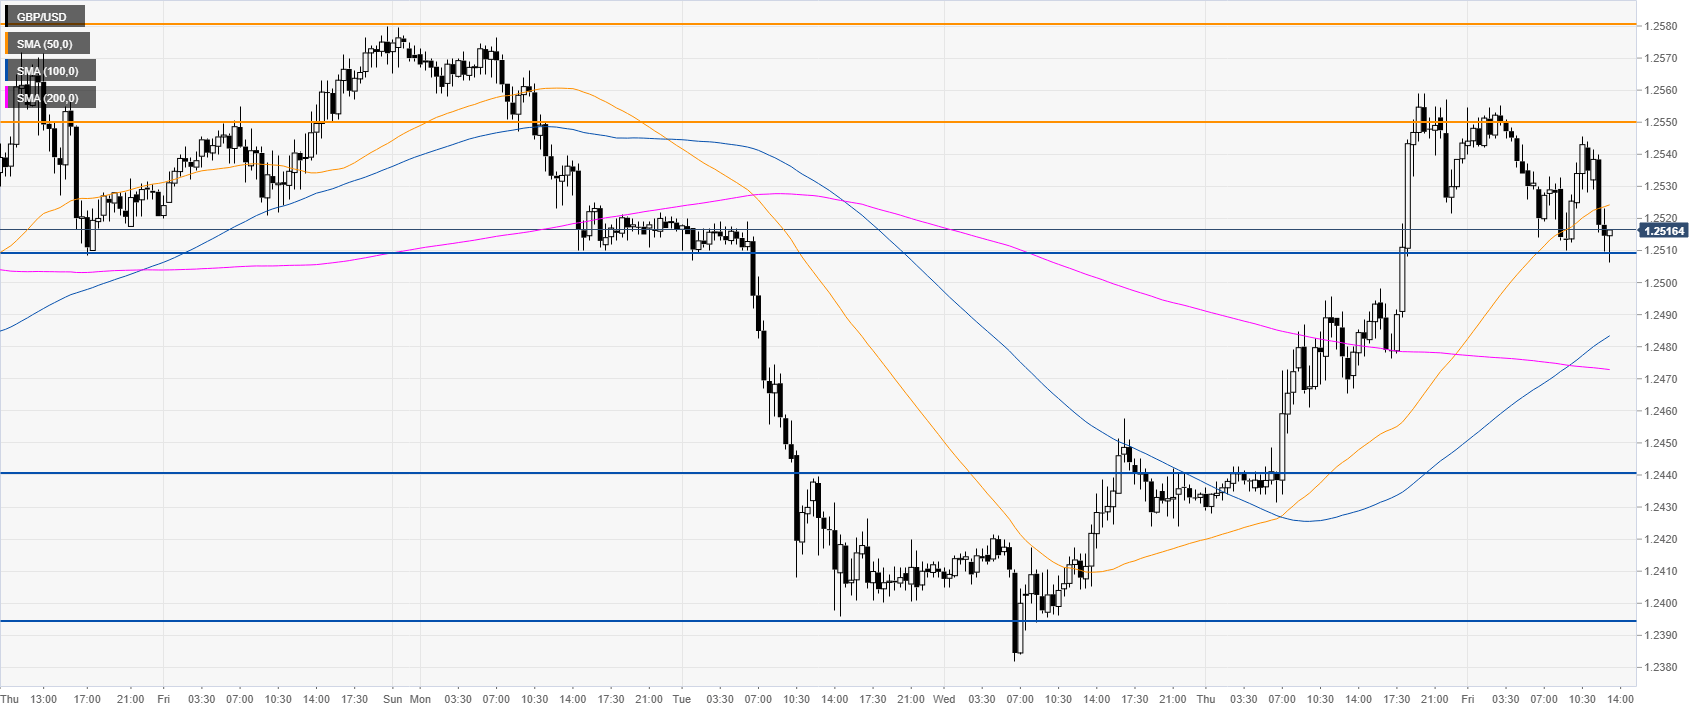
GBP/USD 30-minute chart
GBP/USD is trading at daily lows challenging 1.2509 support while below the 50 SMA. All in all suggesting a potential correction down. Immediate resistances are seen at 1.2550 and 1.2580.
Additional key levels