USD/JPY Technical Analysis: Greenback in a tight range awaiting directional move
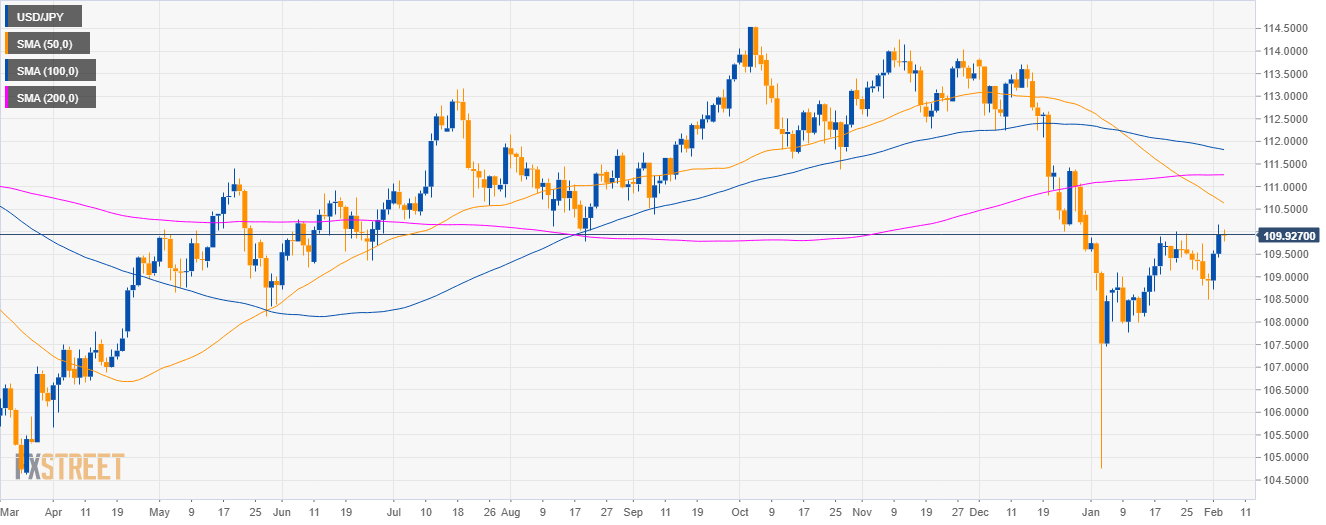
USD/JPY daily chart
- USD/JPY is trading in a deep pullback below the 200-day simple moving averages (SMAs) on the daily chart.
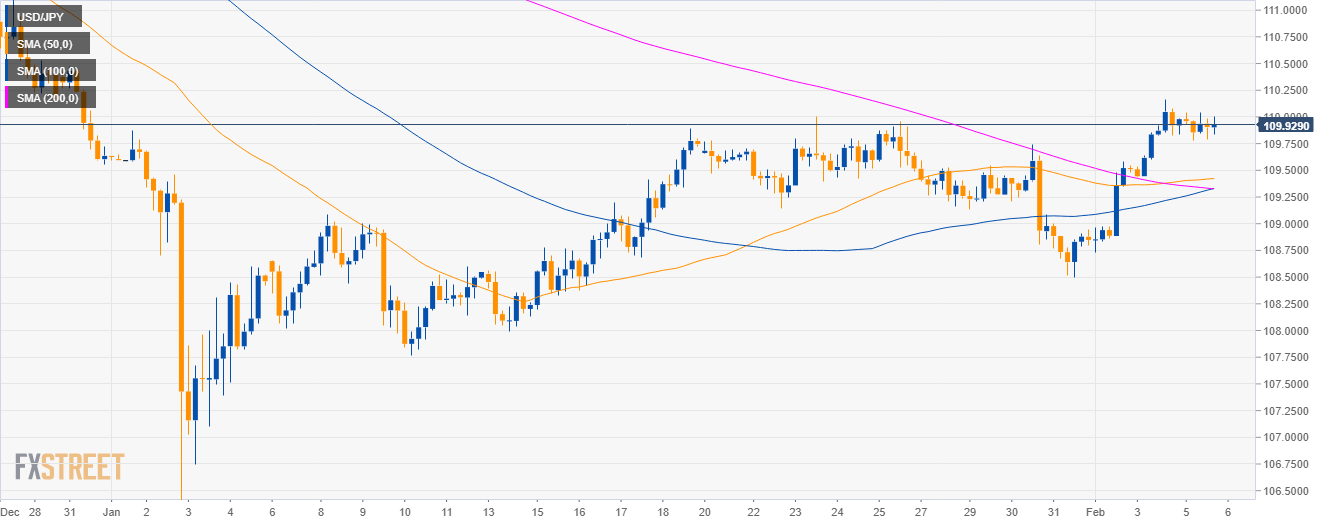
USD/JPY 4-hour chart
- USD/JPY is trading above its main SMAs suggesting bullish momentum.
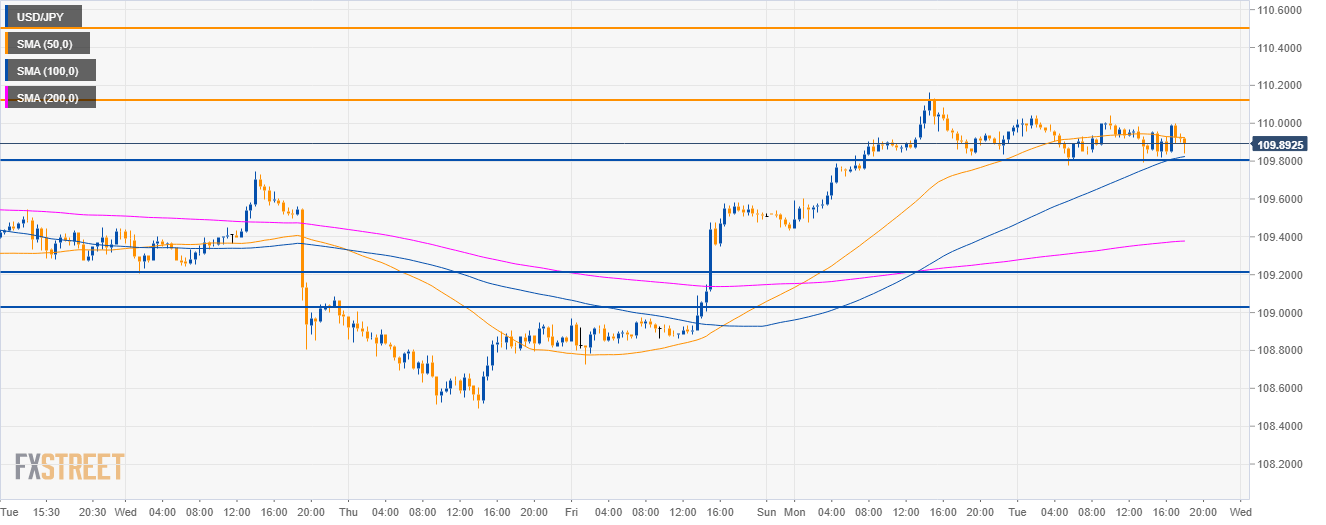
USD/JPY 30-minute chart
- USD/JPY is trading in a tight range just above the 100 SMA.
- Bulls will need to break above 110.15 resistance while bears need a break below 109.80 support.
Additional key levels
USD/JPY
Overview:
Today Last Price: 109.86
Today Daily change: -0.08 pips
Today Daily change %: -7%
Today Daily Open: 109.94
Trends:
Daily SMA20: 109.13
Daily SMA50: 110.71
Daily SMA100: 111.84
Daily SMA200: 111.26
Levels:
Previous Daily High: 110.16
Previous Daily Low: 109.43
Previous Weekly High: 109.74
Previous Weekly Low: 108.5
Previous Monthly High: 110
Previous Monthly Low: 104.75
Daily Fibonacci 38.2%: 109.88
Daily Fibonacci 61.8%: 109.71
Daily Pivot Point S1: 109.52
Daily Pivot Point S2: 109.11
Daily Pivot Point S3: 108.79
Daily Pivot Point R1: 110.26
Daily Pivot Point R2: 110.58
Daily Pivot Point R3: 110.99