Gold Technical Analysis: Yellow Metal set to move up to $1,286.00/oz
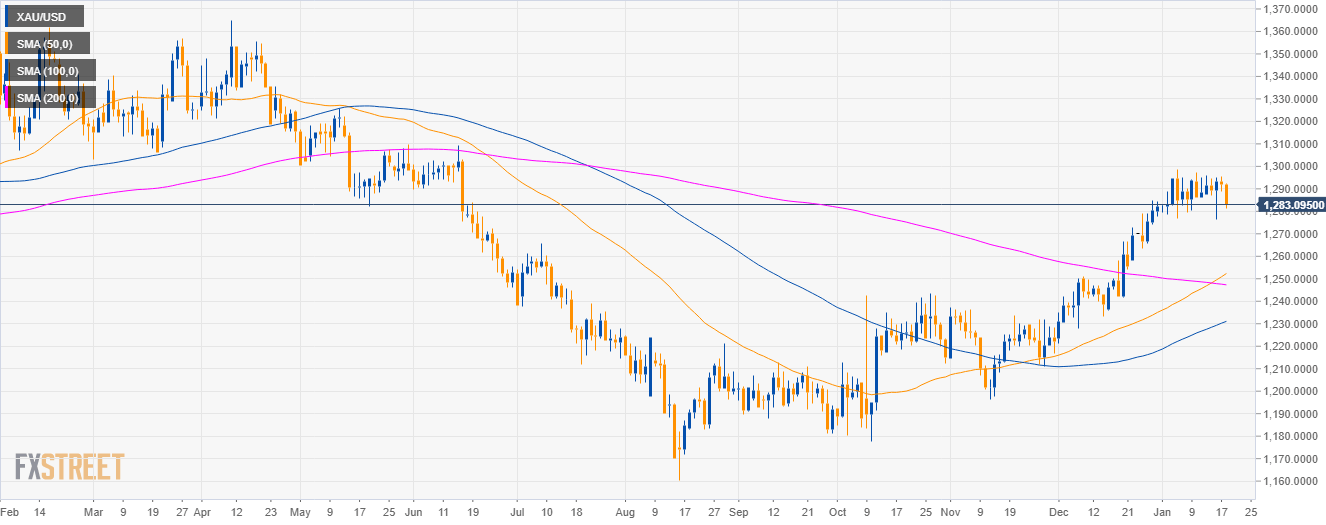
Gold daily chart
- Gold is in a bull trend above its main simple moving averages (SMAs).
- As forecast, the 1,288.75 target has been hit.
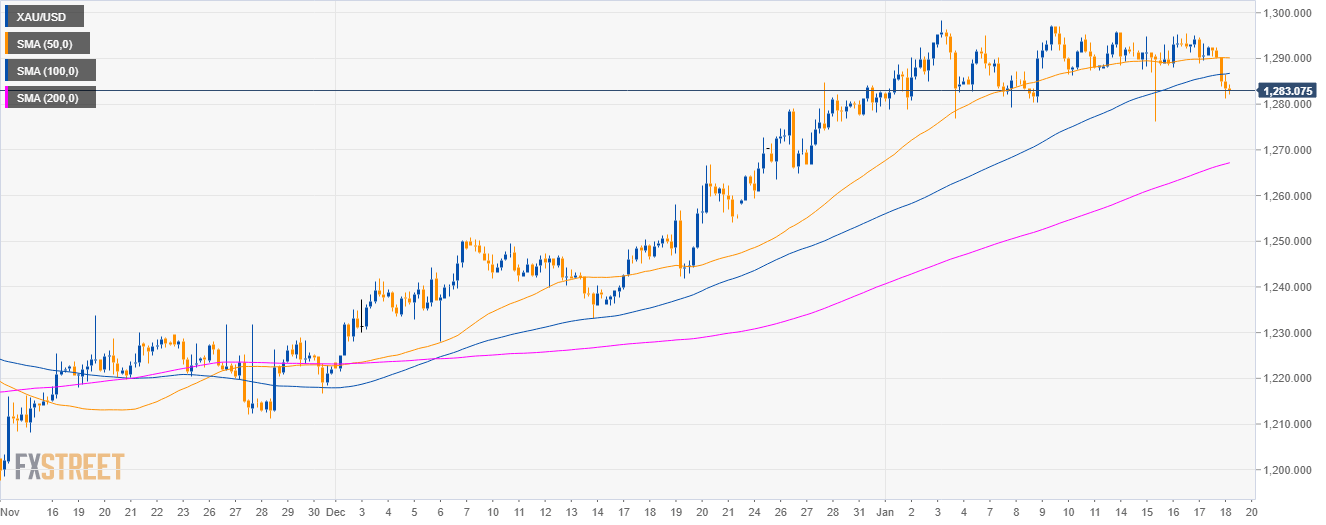
Gold 4-hour chart
- Gold broke below the 50 and 100 SMAs.
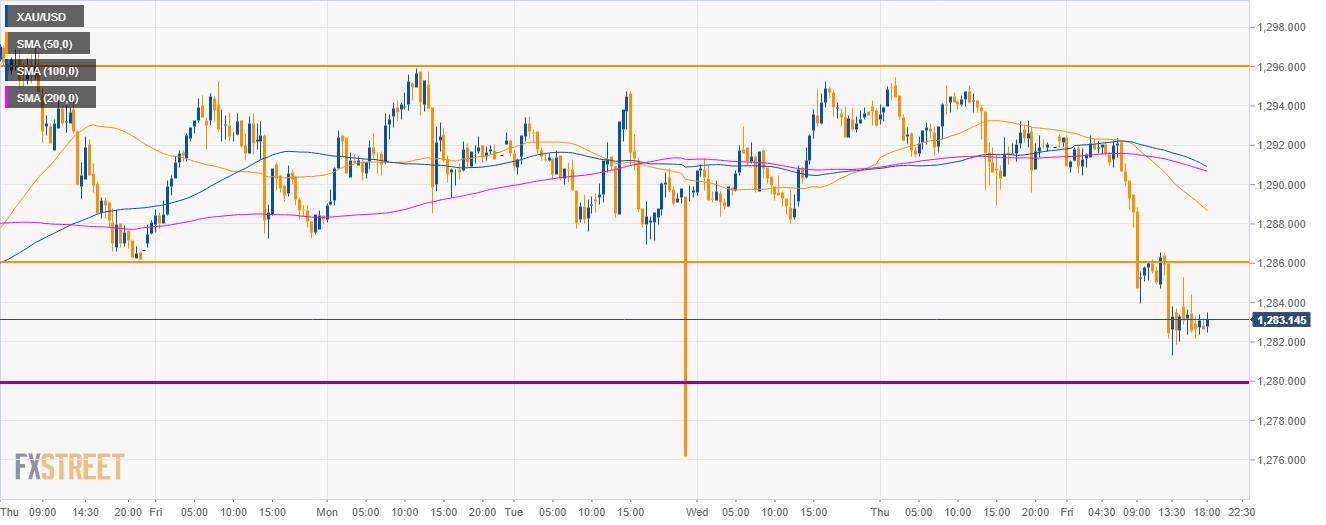
Gold 30-minute chart
- As gold is holding above 1,280.00 a retest of 1286.00 to the upside is on the cards.
Additional key levels
XAU/USD
Overview:
Today Last Price: 1283.4
Today Daily change: -8.49 pips
Today Daily change %: -0.66%
Today Daily Open: 1291.89
Trends:
Daily SMA20: 1282.63
Daily SMA50: 1251.02
Daily SMA100: 1232.26
Daily SMA200: 1228.87
Levels:
Previous Daily High: 1295.45
Previous Daily Low: 1288.95
Previous Weekly High: 1297.15
Previous Weekly Low: 1279.35
Previous Monthly High: 1284.7
Previous Monthly Low: 1221.39
Daily Fibonacci 38.2%: 1291.43
Daily Fibonacci 61.8%: 1292.97
Daily Pivot Point S1: 1288.74
Daily Pivot Point S2: 1285.6
Daily Pivot Point S3: 1282.24
Daily Pivot Point R1: 1295.24
Daily Pivot Point R2: 1298.6
Daily Pivot Point R3: 1301.74