AUD/USD Price Analysis: Aussie pulling back within an uptrend
- AUD/USD has reached the bullish target for a price pattern that formed at the April 19 lows.
- It is currently correcting back but the overall uptrend suggests it will recover.
- Support from the zone around the trendline is likely to provide the springboard for a reversal higher.
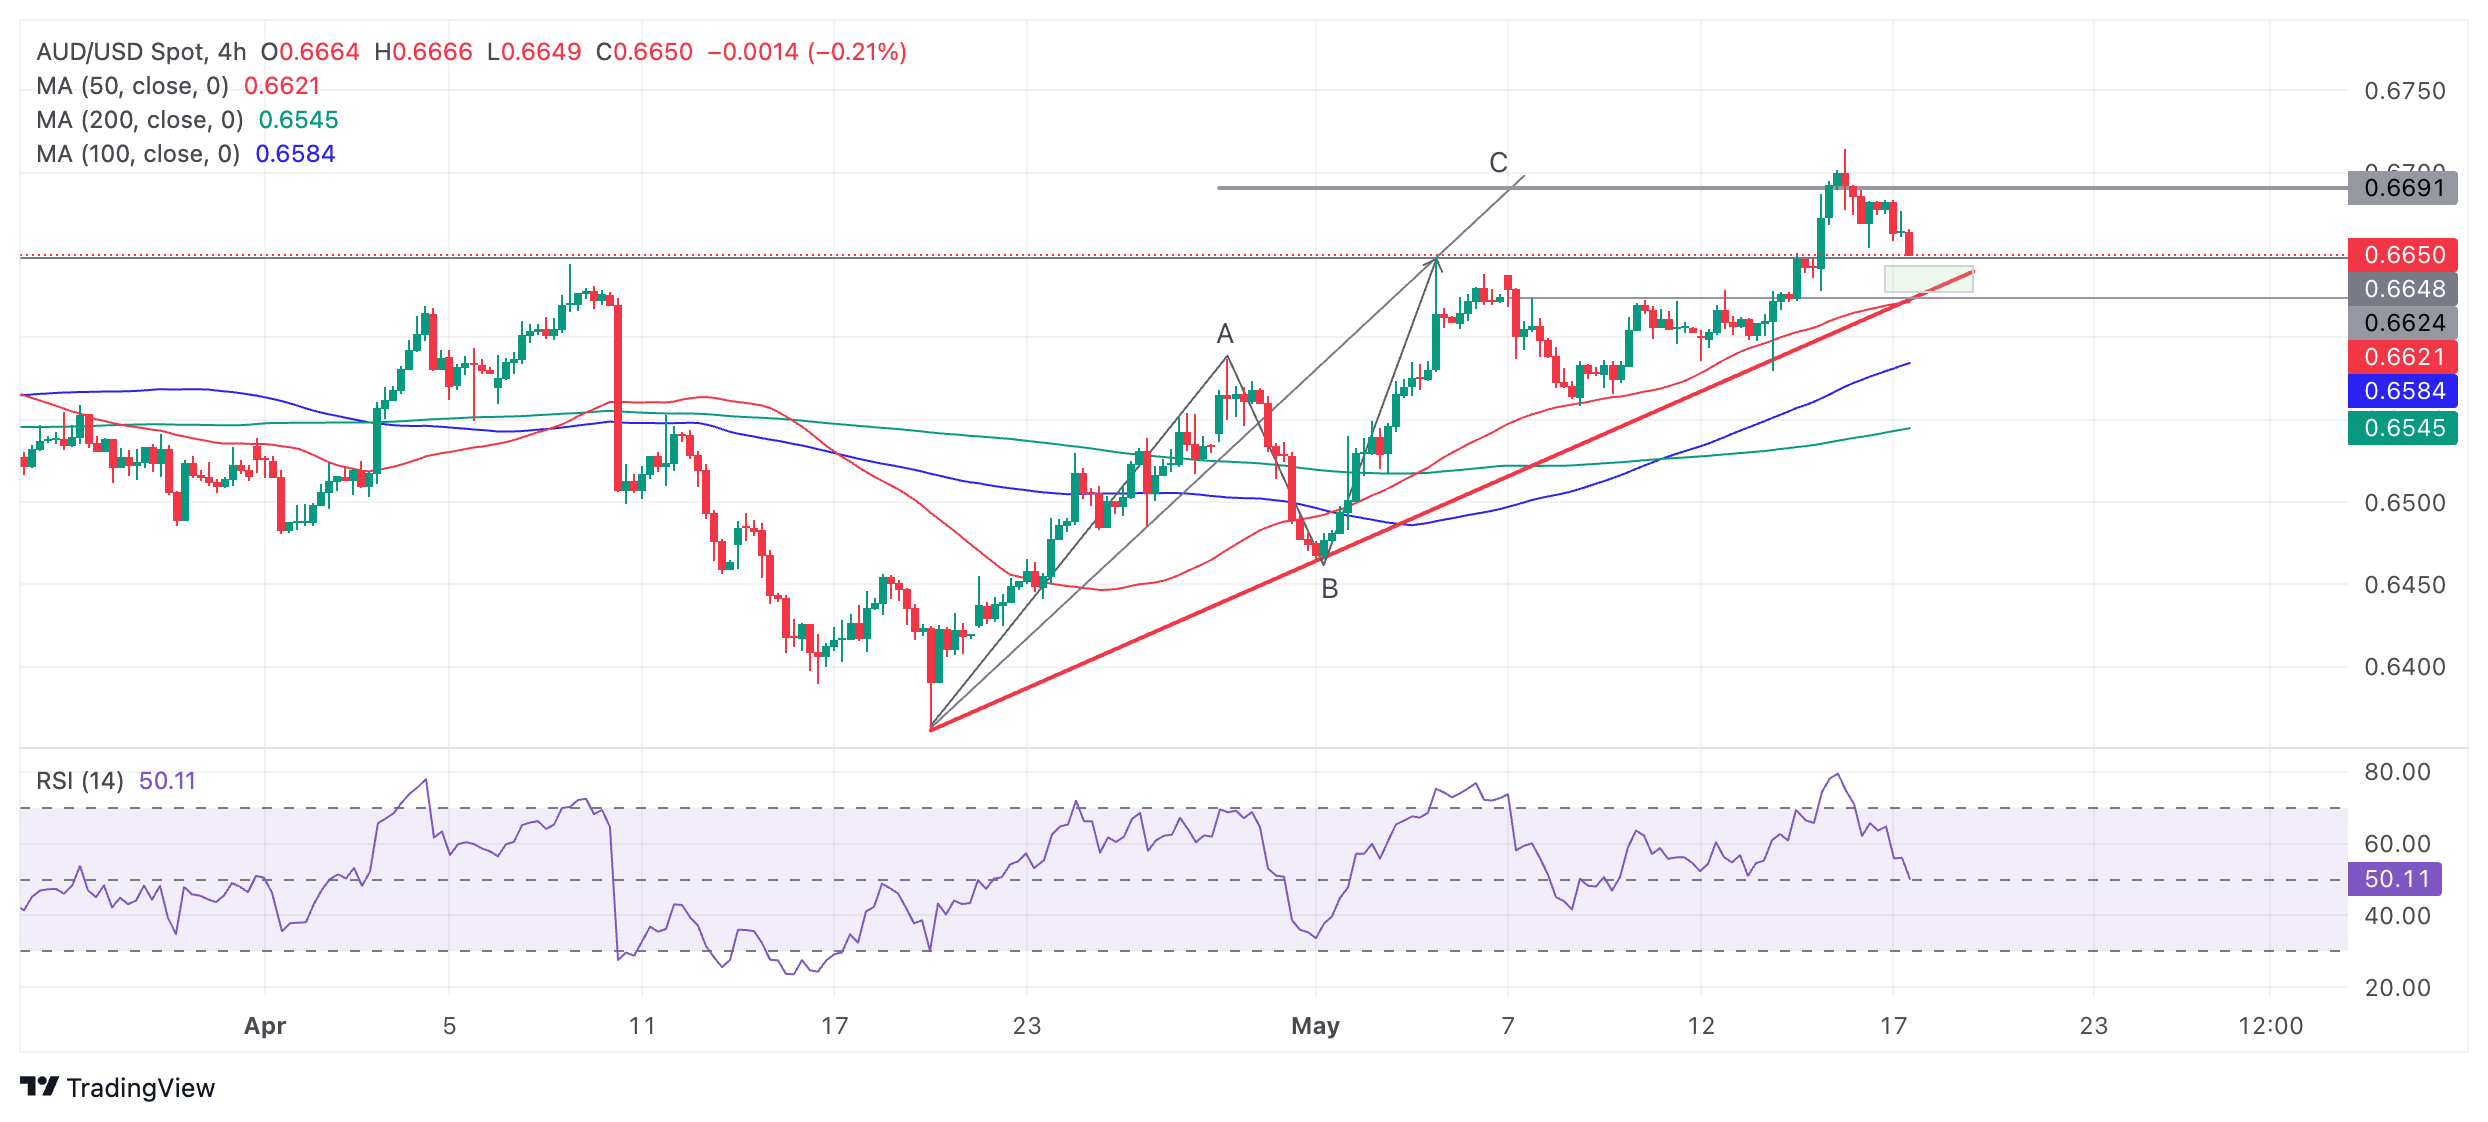
AUD/USD reached a key upside target on May 16 and has retraced. The pair is in a short-term uptrend and the pull back is likely to be a temporary correction before the uptrend continues.
AUD/USD 4-hour Chart
AUD/USD will probably find support at the red trendline for the move up and then reverse and start moving higher again. There are no signs yet it is resuming its uptrend however.
A break above the 0.6714 high of May 16 will create a higher high and confirm a continuation of the uptrend.
The pair has now reached the target for the Measured Move pattern which formed from the April 19 lows. Measured Moves are zig-zag like patterns composed of three waves, usually labeled A, B and C. The general expectation is that wave C will reach either the same length as A or a Fibonacci 0.681 ratio of A.
Wave C has now fulfilled both these targets.
A decisive break below the red trendline would be a bearish sign and could denote a change of the short-term trend.
Decisive would be characterized as a break that was accompanied by a long red candle that closed near its low or three red candles in a row that broke through the trendline.

